Global Statistics
View platform-wide analytics and metrics
The statistics dashboard – 14s, no narration
Accessing Global Statistics
Global statistics for the system are available in the "Statistics" tab of the sidebar menu.
Overall Statistics (Analytics)
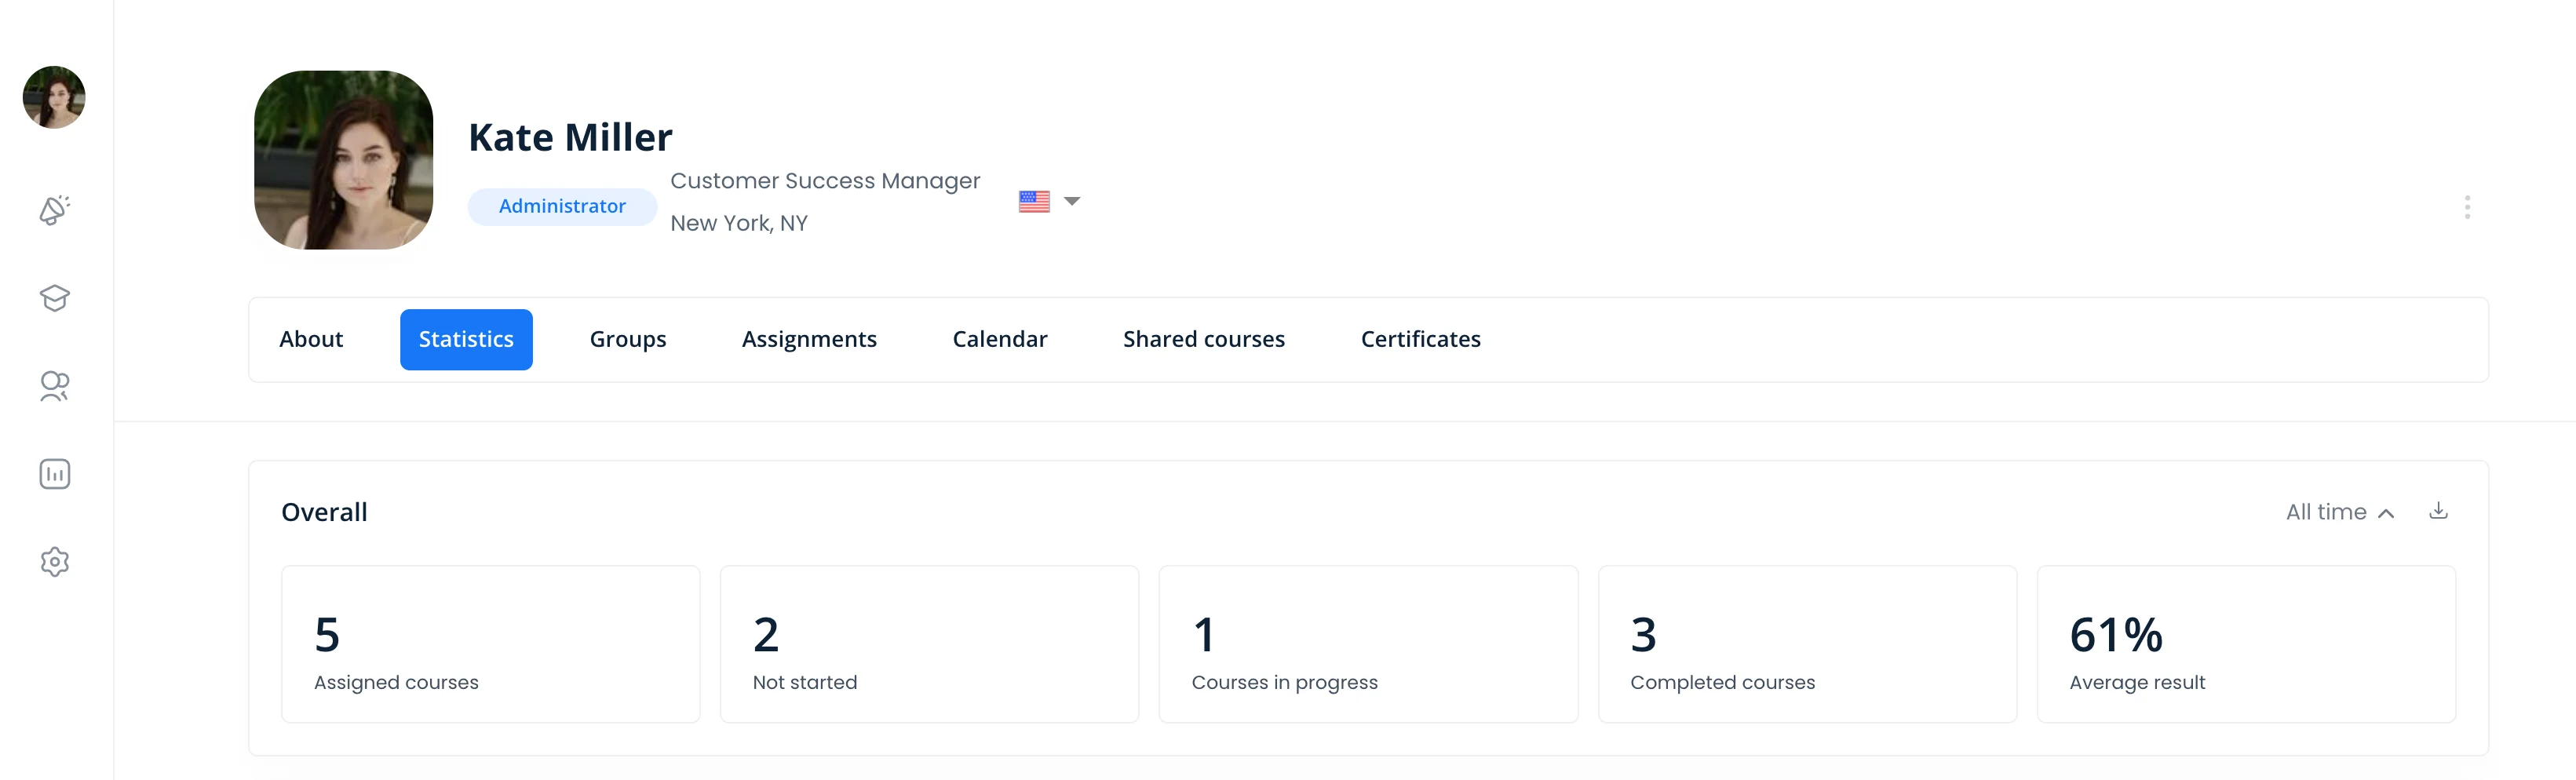
The overall statistics field shows:
- Number of courses published in the system
- Number of active users in the system
- Number of user groups
Leaders
In the leaderboard table, users (or groups of users) are represented with dots, indicating their results in terms of the number of completed courses compared to the average result for completed courses.
This visualization helps identify:
- Top performers across the entire platform
- Users or groups that need support
- Overall engagement patterns
Courses
The graph displays the number of courses created, published, and assigned.
- X-axis: Time points, which can be adjusted depending on the selected period
- Y-axis: Number of courses
This helps track:
- Course creation velocity
- Publication trends
- Assignment patterns over time
Users Without Results
This field provides a list of all system users who have started at least one of the courses assigned to them but have not yet completed any.
Inactive Users
This list includes system users who have not yet started any of the courses assigned to them.
Common reasons for inactivity:
- Users haven't received or seen course notifications
- Courses assigned don't align with user needs or interests
- Technical barriers preventing access
- Lack of time or motivation
Unassigned Courses
This is a list of published courses for which assignments have not yet been made.
User Filtering
To find users more quickly, you can customize filters in the "Users" and "Groups" tabs of the "Team" section in the sidebar menu.
For user filtering, you can use filters based on:
- Roles
- Registration dates in the system
For group filtering, you can use a filter based on:
- Number of users
The Learning View
The learning view plots everyone in your organisation on two numbers at once: how much of what they were assigned they have completed, and what they are averaging on it.
That splits your people into four groups rather than one ranked list:
- Leaders - high completion and high scores
- Challengers - high scores, but little finished so far
- Outsiders - plenty finished, at low scores
- Beginners - low on both
Alongside it, the User leaderboard ranks your top performers directly. Inactive learners sit outside the quadrants entirely, which is usually the group worth acting on first.
Insights
Insights is the tab that does the digging for you, and it is the fastest route from a dashboard to something you can actually fix.
It surfaces three ranked lists:
- Hardest Questions - the questions most learners get wrong
- Lowest Completion - the courses people start and do not finish
- Toughest Tests - the tests with the lowest pass rates
Best Practices
- Monitor platform health: Regularly review global statistics to understand overall system usage
- Identify system-wide trends: Use course creation and assignment graphs to spot patterns
- Address inactive users: Develop strategies to engage users who haven't started courses
- Optimize course assignments: Review unassigned courses and assign them to relevant users/groups
- Benchmark performance: Use leaders data to set realistic performance expectations
- Export and analyze: Download CSV files for deeper analysis in external tools
- Set platform goals: Establish targets for course completion rates, active users, and engagement
- Compare time periods: Track how metrics change over weeks, months, or quarters
- Use filters effectively: Leverage filtering to quickly identify specific user segments
Related Topics
- Course Statistics - Drill down into individual course metrics
- Group Statistics - View team-level performance
- User Statistics - Access individual learner data